
Diff for 'CTX'
|
Editor:
Volat, Matthieu
Size:
3000:
Time:
2019-03-08 19:20:49z
Comment:
Improve help on how to process CTX data.
|
Editor:
Volat, Matthieu
Size:
5370:
Time:
2022-07-28 14:39:45z
Comment:
|
| Deletions are marked like this. | Additions are marked like this. |
| Line 8: | Line 8: |
| == Data description == | == Instrument description == |
| Line 10: | Line 10: |
| The following CTX products are available on MarsSI: | ... |
| Line 12: | Line 12: |
| * EDR image: Raw image in a standard format called the Experiment Data Record * RDR image: Converted raw image into reflectance (irradiance/solar flux or I/F) called Radiometric Data Record * MRDR image: Projected image from RDR image |
== Downloading and processing CTX data == |
| Line 16: | Line 14: |
| === Imagery === | |
| Line 17: | Line 16: |
| The CTX files have names like `P16_007430_1783_XN_01S083W`. | ==== Tutorial ==== |
| Line 19: | Line 18: |
| From the “Maps” tab, zoom-in on your region of interest. You can swith to the THEMIS or CTX mosaic for more precision, and then display the CTX layer. You can see the CTX products footprints that appear in pink. Use the “Select” button to choose the products you desire over an area. Use the right-click context menu to add your selection to your workspace. | |
| Line 20: | Line 20: |
| == Processing CTX data == | {{attachment:select_ctx.jpg||width="800"}} In the "Workspace" tab, you will see your product selection. CTX images can be processed in different steps: first a raw product (EDR) is downloaded. It can be processed into a calibrated RDR product. The last step reproject and georeference the RDR product into a MRDR image. Check the product status: if some data is not already done yet, select the rows you would like to request by ticking the input on the left column (you can use the "Select all" button to select all visible products) and click on the "Process" action on the top of the workspace table. You can check more information about the processing in the job tab if needed. Once all the data you would like is done, select entries by ticking the input on the left column (you can use the "Select all" button to select all visible products) and click on the "Copy" action to request a copy of the data in your personal directory. You can then proceed to download products as described in the SFTP section. ==== Pipeline information ==== |
| Line 24: | Line 32: |
| From the “Maps” tab, zoom-in on your region of interest, you can display the THEMIS mosaic for more precision, and then display the CTX layer. You get all CTX stamps that appear in green. The stamps are regularly updated to take into account new data. You can use the “Select” button to choose the stamp you desire. You can choose several stamps by clicking several stamps, or by dragging your mouse to select adjacent stamps. You can also use the “Search” button for more options. | === Digital Elevation Models === |
| Line 26: | Line 34: |
| To add your desired stamps to your cart click on “Add” in the “Cart” window, and go to the “Workspace” tab. Your CTX image appears in the window “Data to process”. If not, you may already have processed it yourself, or someone else may have processed it, then it may already be in the “Data processed” window. If the image has not been processed, you will have to go through several steps: | ==== Tutorial ==== |
| Line 28: | Line 36: |
| 1. Download the CTX EDR image (rawdata) to the MarsSI server by clicking on the EDR image and the “Process” button in the “Data to process” window. This will take a few minutes. 2. When the first step is done, you can create a calibrated RDR image: click on the proposed RDR image in the “Data to process” window and on the “Process” button. This will take another few minutes, depending on the length of the CTX observation. 3. Project the CTX image by processing the proposed MRDR image in the “Data to process” window. This will take more time than the previous processes, another few minutes. |
From the “Maps” tab, zoom-in on your region of interest. You can swith to the THEMIS or CTX mosaic for more precision, and then display the CTX-stereo layer. You can see the CTX-DEM products footprints that appear in blue. Use the “Select” button to choose the products you desire over an area. Use the right-click context menu to add your selection to your workspace. |
| Line 32: | Line 38: |
| When these different steps are done, the MRDR image is waiting for you in the “Data processed” window and you can copy it to your FTP partition. | {{attachment:select_ctxdem.jpg||width="800"}} In the "Workspace" tab, you will see your product selection. Check the product status: if some data is not already done yet, select the rows you would like to request by ticking the input on the left column (you can use the "Select all" button to select all visible products) and click on the "Process" action on the top of the workspace table. You can check more information about the processing in the job tab if needed. Once all the data you would like is done, select entries by ticking the input on the left column (you can use the "Select all" button to select all visible products) and click on the "Copy" action to request a copy of the data in your personal directory. You can then proceed to download products as described in the SFTP section. ==== Pipeline information ==== {{{#!wiki warning The DEM footprints have been created automatically based on the percentage of intersection and the difference in emission angle between the two input images. Please be advised that DEM creation process can fail due to other parameters. See [[DemErrors]] for more information. }}} The CTX DEM images created by MarsSI are generated using the NASA AMES Stereo Pipeline (http://ti.arc.nasa.gov/tech/asr/intelligent-robotics/ngt/stereo/). == Data description == === Images === ==== Directory content ==== The content of an CTX product directory in MarsSI should look like: P16_007430_1783_XN_01S083W.IMG:: raw data (Experiment Data Record) P16_007430_1783_XN_01S083W_RDR.cub:: reflectance (irradiance/solar flux or I/F) called Radiometric Data Record P16_007430_1783_XN_01S083W_MRDR.tif:: projected and georeferenced image from the RDR ==== Georeferencing ==== Due to the ISIS format, probably only some GIS software will be able to display RDR products, but only the MRDR products have georeferencing and can be displayed in a true geographic view. === DEMs === ==== Directory content ==== The content of an CTX-DEM product directory in MarsSI should look like: CTX_024513_1991_052943_1983-ALIGN-DEM.tif:: DEM product, aligned to MOLA CTX_024513_1991_052943_1983-ALIGN-DRG.tif:: left image aligned and orthorectified along the DEM at its resolution Older directory could include non-aligned DEM/imagery. |
| Line 38: | Line 85: |
| * USGS ISIS software: https://isis.astrogeology.usgs.gov/ * Ames Stereo Pipeline: https://ti.arc.nasa.gov/tech/asr/groups/intelligent-robotics/ngt/stereo/ |
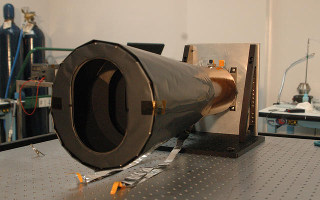
The Context Camera (CTX) is a camera on board the Mars Reconnaissance Orbiter (MRO) acquiring grayscale images at 6 meters per pixel scale over a swath 30 kilometers wide. CTX provides context images for the MRO HiRISE and CRISM observations, is used to monitor changes occurring on the planet, and acquires stereo pairs of selected, critical science targets.
Instrument description
..
Downloading and processing CTX data
Imagery
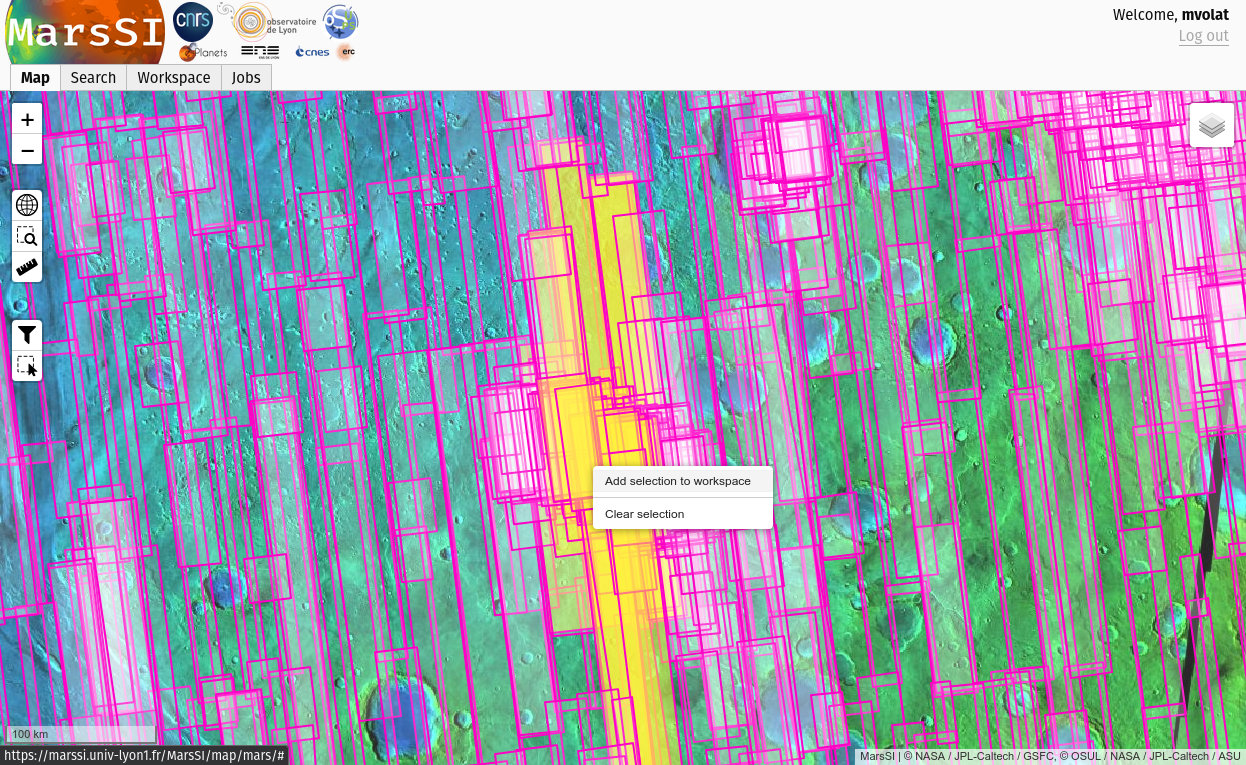
Tutorial
From the “Maps” tab, zoom-in on your region of interest. You can swith to the THEMIS or CTX mosaic for more precision, and then display the CTX layer. You can see the CTX products footprints that appear in pink. Use the “Select” button to choose the products you desire over an area. Use the right-click context menu to add your selection to your workspace.
In the "Workspace" tab, you will see your product selection. CTX images can be processed in different steps: first a raw product (EDR) is downloaded. It can be processed into a calibrated RDR product. The last step reproject and georeference the RDR product into a MRDR image.
Check the product status: if some data is not already done yet, select the rows you would like to request by ticking the input on the left column (you can use the "Select all" button to select all visible products) and click on the "Process" action on the top of the workspace table. You can check more information about the processing in the job tab if needed.
Once all the data you would like is done, select entries by ticking the input on the left column (you can use the "Select all" button to select all visible products) and click on the "Copy" action to request a copy of the data in your personal directory. You can then proceed to download products as described in the SFTP section.
Pipeline information
The pipelines used for the data calibration and projection are those proposed by ISIS3 (https://isis.astrogeology.usgs.gov/index.html).
Digital Elevation Models
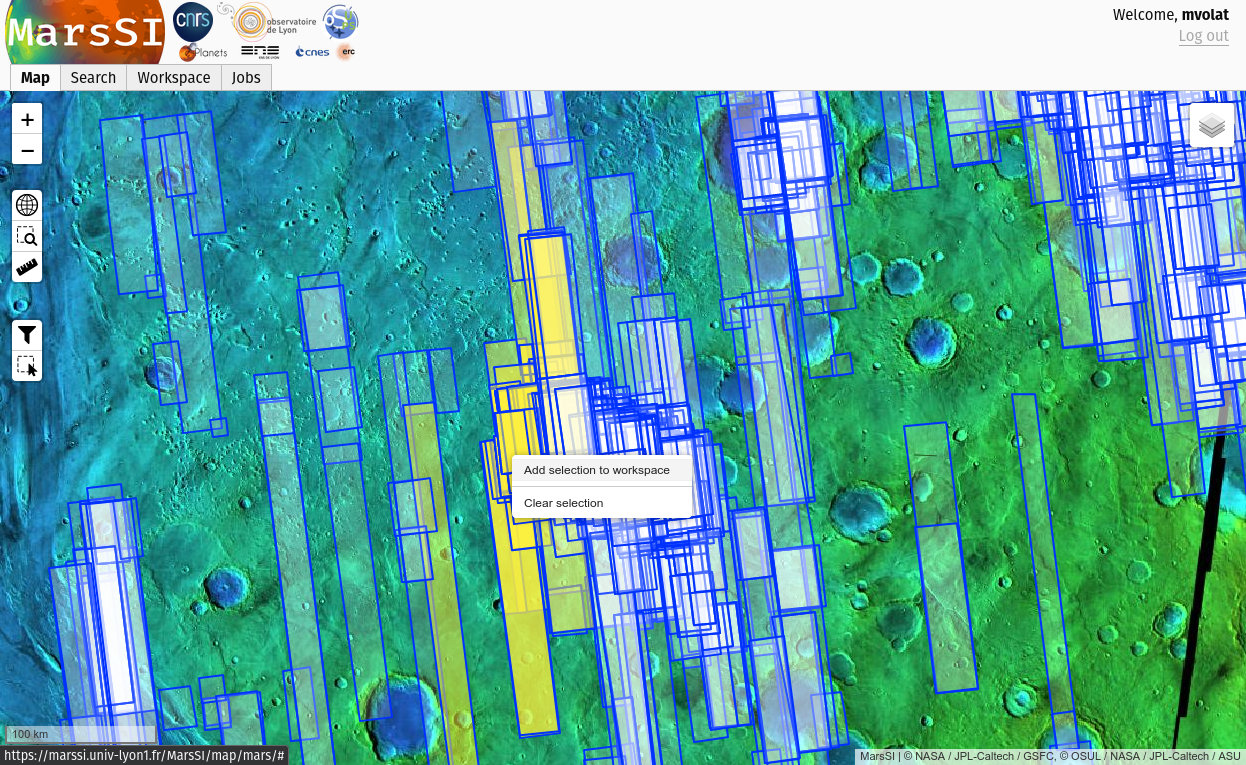
Tutorial
From the “Maps” tab, zoom-in on your region of interest. You can swith to the THEMIS or CTX mosaic for more precision, and then display the CTX-stereo layer. You can see the CTX-DEM products footprints that appear in blue. Use the “Select” button to choose the products you desire over an area. Use the right-click context menu to add your selection to your workspace.
In the "Workspace" tab, you will see your product selection.
Check the product status: if some data is not already done yet, select the rows you would like to request by ticking the input on the left column (you can use the "Select all" button to select all visible products) and click on the "Process" action on the top of the workspace table. You can check more information about the processing in the job tab if needed.
Once all the data you would like is done, select entries by ticking the input on the left column (you can use the "Select all" button to select all visible products) and click on the "Copy" action to request a copy of the data in your personal directory. You can then proceed to download products as described in the SFTP section.
Pipeline information
The DEM footprints have been created automatically based on the percentage of intersection and the difference in emission angle between the two input images. Please be advised that DEM creation process can fail due to other parameters. See DemErrors for more information.
The CTX DEM images created by MarsSI are generated using the NASA AMES Stereo Pipeline (http://ti.arc.nasa.gov/tech/asr/intelligent-robotics/ngt/stereo/).
Data description
Images
Directory content
The content of an CTX product directory in MarsSI should look like:
- P16_007430_1783_XN_01S083W.IMG
- raw data (Experiment Data Record)
- P16_007430_1783_XN_01S083W_RDR.cub
- reflectance (irradiance/solar flux or I/F) called Radiometric Data Record
- P16_007430_1783_XN_01S083W_MRDR.tif
- projected and georeferenced image from the RDR
Georeferencing
Due to the ISIS format, probably only some GIS software will be able to display RDR products, but only the MRDR products have georeferencing and can be displayed in a true geographic view.
DEMs
Directory content
The content of an CTX-DEM product directory in MarsSI should look like:
- CTX_024513_1991_052943_1983-ALIGN-DEM.tif
- DEM product, aligned to MOLA
- CTX_024513_1991_052943_1983-ALIGN-DRG.tif
- left image aligned and orthorectified along the DEM at its resolution
Older directory could include non-aligned DEM/imagery.
References
- CTX instrument description website: http://www.msss.com/all_projects/mro-ctx.php
- CTX instrument description paper: Malin et al., (2007), Context Camera Investigation on board the Mars Reconnaissance Orbiter, Journal of Geophysical Research, 112, E05S04, doi: 10.1029/2006JE002808.
- USGS ISIS software: https://isis.astrogeology.usgs.gov/
- Ames Stereo Pipeline: https://ti.arc.nasa.gov/tech/asr/groups/intelligent-robotics/ngt/stereo/