
Diff for 'HiRISE'
|
Editor:
Volat, Matthieu
Size:
7921:
Time:
2020-09-08 11:44:08z
Comment:
|
Editor:
mvolat
Size:
8575:
Time:
2024-08-27 09:03:40z
Comment:
|
| Deletions are marked like this. | Additions are marked like this. |
| Line 1: | Line 1: |
{{https://upload.wikimedia.org/wikipedia/commons/2/2b/HiRISE_Flight_Structure.jpg||align="right",width="240"}} |
{{https://upload.wikimedia.org/wikipedia/commons/2/2b/HiRISE_Flight_Structure.jpg||width="240"}} |
| Line 5: | Line 4: |
| <<TableOfContents()>> | |
| Line 6: | Line 6: |
| <<TableOfContents()>> | == Instrument description == The HiRISE camera has 3 different color filtered CCDs: red (“RED”) from 570-830 nm, blue-green (“BG”) less than 580 nm and near-infrared (“IR”) greater than 790 nm. The high-resolution color images enable to distinguish the composition and albedo heterogeneities directly correlated to the geomorphology, complementary to the mineralogic results from the CRISM, HRSC, OMEGA and THEMIS instruments. The RED detectors provide a wide image used for geomorphologic analysis and for stereoanalysis, while the additional detectors are used to create false-color imaging of the central of the swath only (20% of the RED swath width). == Downloading and processing HIRISE data == === Imagery === ==== Tutorial ==== From the “Maps” tab, zoom-in on your region of interest. You can swith to the THEMIS or CTX mosaic for more precision, and then display the HiRISE layer. You can see the HiRISE products footprints that appear in pink. Use the “Select” button to choose the products you desire over an area. Use the right-click context menu to add your selection to your workspace. {{/select_hirise.jpg||width="800"}} In the "Workspace" tab, you will see your product selection. You will notice that there is two type of subproducts: the RED channel with a higher coverage products and the COLOR products (see "Instrument description for more information about coverage and color information). HiRISE color images are downloaded calibrated and with georeferencement, there is no more processing on this data type. HiRISE RED images can be processed in different steps: first a raw product (EDR) is downloaded. It can be processed into a calibrated RDR product. The last step reproject and georeference the RDR product into a MRDR image. Check the product status: if some data is not already done yet, select the rows you would like to request by ticking the input on the left column (you can use the "Select all" button to select all visible products) and click on the "Process" action on the top of the workspace table. You can check more information about the processing in the job tab if needed. Once all the data you would like is done, select entries by ticking the input on the left column (you can use the "Select all" button to select all visible products) and click on the "Copy" action to request a copy of the data in your personal directory. You can then proceed to download products as described in the SFTP section. ==== Pipeline information ==== The pipeline for the topographic mapping derived from HiRISE images uses both the USGS ISIS system (the ISIS 3 system). === MarsSI Digital Elevation Models === ==== Tutorial ==== From the “Maps” tab, zoom-in on your region of interest. You can swith to the THEMIS or CTX mosaic for more precision, and then display the HiRISE-stereo layer. You can see the HiRISE-DEM products footprints that appear in blue. Use the “Select” button to choose the products you desire over an area. Use the right-click context menu to add your selection to your workspace. {{/select_hirisedem.jpg||width="800"}} In the "Workspace" tab, you will see your product selection. Check the product status: if some data is not already done yet, select the rows you would like to request by ticking the input on the left column (you can use the "Select all" button to select all visible products) and click on the "Process" action on the top of the workspace table. You can check more information about the processing in the job tab if needed. Once all the data you would like is done, select entries by ticking the input on the left column (you can use the "Select all" button to select all visible products) and click on the "Copy" action to request a copy of the data in your personal directory. You can then proceed to download products as described in the SFTP section. ==== Pipeline information ==== {{{#!wiki warning The DEM footprints have been created automatically based on the percentage of intersection and the difference in emission angle between the two input images. Please be advised that DEM creation process can fail due to other parameters. See [[DemErrors]] for more information. }}} The HiRISE DEM images created by MarsSI are generated using the NASA AMES Stereo Pipeline ([[http://ti.arc.nasa.gov/tech/asr/intelligent-robotics/ngt/stereo/%29|http://ti.arc.nasa.gov/tech/asr/intelligent-robotics/ngt/stereo/)]]. === HiRISE Team Digital Elevation Models === ==== Tutorial ==== From the “Maps” tab, zoom-in on your region of interest. You can swith to the THEMIS or CTX mosaic for more precision, and then display the HiRISE-team-DTM layer. You can see the HiRISE-DEM products footprints that appear in light blue. Use the “Select” button to choose the products you desire over an area. Use the right-click context menu to add your selection to your workspace. {{/select_hiriseteamdtm.jpg||width="800"}} In the "Workspace" tab, you will see your product selection. Check the product status: if some data is not already done yet (for HiRISE team DEMs, this only means downloading it), select the rows you would like to request by ticking the input on the left column (you can use the "Select all" button to select all visible products) and click on the "Process" action on the top of the workspace table. You can check more information about the processing in the job tab if needed. Once all the data you would like is done, select entries by ticking the input on the left column (you can use the "Select all" button to select all visible products) and click on the "Copy" action to request a copy of the data in your personal directory. You can then proceed to download products as described in the SFTP section. ==== Pipeline information ==== This dataset was created using the commercial stereogrammetric software SOCET SET and tuned by hand by the HiRISE team. The DTMs have a 1-meter spatial resolution and 25 cm vertical precision. For more details about the process used to create HiRISE DTMs, see [[http://onlinelibrary.wiley.com/wol1/doi/10.1029/2007JE003000/full|Kirk, R.L. et al. (2008)]]. |
| Line 10: | Line 72: |
| The HiRISE camera has 3 different color filtered CCDs: red (“RED”) from 570-830 nm, blue-green (“BG”) less than 580 nm and near-infrared (“IR”) greater than 790 nm. The high-resolution color images enable to distinguish the composition and albedo heterogeneities directly correlated to the geomorphology, complementary to the mineralogic results from the CRISM, HRSC, OMEGA and THEMIS instruments. The RED detectors provide a wide image used for geomorphologic analysis and for stereoanalysis, while the additional detectors are used to create false-color imaging of the central of the swath only (20% of the RED swath width). | === Images === |
| Line 12: | Line 74: |
| Data file description: * `PSP_005000_1000_RED.JP2` (grayscale mosaic of all RED-filter channels) * `PSP_005000_1000_COLOR.JP2` (IR, RED, BG 3-color product over center 20% of the RED swath width) |
==== Directory content ==== |
| Line 16: | Line 76: |
| Each JP2 image also has a PDS label (.lbl) providing useful information about the observation such as map projection and viewing information. | The content of an HiRISE product directory in MarsSI should look like: |
| Line 18: | Line 78: |
| == Processing HIRISE data == | ESP_011261_1960_RED*_*.IMG:: :: raw red data (EDR), multiple files ESP_011261_1960_RED_RDR.cub:: :: reflectance (irradiance/solar flux or I/F) called Radiometric Data Record, stitched in a single image ESP_011261_1960_RED_MRDR.tif:: :: projected and georeferenced image from the RDR ESP_011261_1960_COLOR.tif:: :: projected and georeferenced color image (RDRV11) |
| Line 20: | Line 87: |
| === HiRISE Imagery === | ==== Georeferencing ==== |
| Line 22: | Line 89: |
| The pipeline for the topographic mapping derived from HiRISE images uses both the USGS ISIS system (the ISIS 3 system). | Due to the ISIS format, probably only some GIS software will be able to display RDR products, but only the MRDR products have georeferencing and can be displayed in a true geographic view. |
| Line 24: | Line 91: |
| From the “Maps” tab, zoom-in on your region of interest, you can display the THEMIS mosaic for more precision, and then display the HiRISE layer. You get all HiRISE footprints that appear in blue. The footprints are regularly updated to take into account new data. You can use the “Select” button to choose the footprint you desire. You can choose several footprints by clicking several footprints, or by dragging your mouse to select adjacent footprints. You can also use the “Search” button for more options. | === MarsSI Digital Elevation Models === |
| Line 26: | Line 93: |
| {{attachment:view_hirise_layer.png||width="800"}} | ==== Directory content ==== |
| Line 28: | Line 95: |
| To add your desired footprints to your cart click on “Add” in the “Cart” window, and go to the “Workspace” tab. Your HiRISE image appears in the window “Data to process”. If not, you may already have processed it yourself, or someone else may have processed it, then it may already be in the “Data processed” window. If the image has not been processed, you will have to go through several steps: | The content of an CTX-DEM product directory in MarsSI should look like: |
| Line 30: | Line 97: |
| 1. Download the HiRISE EDR image (rawdata) to the MarsSI server by clicking on the EDR image and the “Process” button in the “Data to process” window. This will take a few minutes. 2. When the first step is done, you can create a calibrated RDR image: click on the proposed RDR image in the “Data to process” window and on the “Process” button. This will take another few minutes, depending on the length of the observation. 3. Project the image by processing the proposed MRDR image in the “Data to process” window. This will take more time than the previous processes, another few minutes. |
HI_022288_2035_022354_2035-ALIGN-DEM.tif:: :: DEM product, aligned to MOLA HI_022288_2035_022354_2035-ALIGN-DRG.tif:: :: left image aligned and orthorectified along the DEM at its resolution |
| Line 34: | Line 102: |
| When these different steps are done, the MRDR image is waiting for you in the “Data processed” window and you can copy it to your SFTP partition. | Older directory could include non-aligned DEM/imagery. |
| Line 36: | Line 104: |
| === Digital Elevation Model === | === HiRISE Team Digital Elevation Models === |
| Line 38: | Line 106: |
| ==== MarsSI DEM ==== | ==== Directory content ==== |
| Line 40: | Line 108: |
| {{{#!wiki important In order to realize a HiRISE DEM, you must have proceeded through all the HiRISE imagery processing steps, described in the previous section. }}} The HiRISE DTM images created by MarsSI are generated using the NASA AMES Stereo Pipeline (http://ti.arc.nasa.gov/tech/asr/intelligent-robotics/ngt/stereo/). From the “Maps” tab, zoom-in on your region of interest, you can display the THEMIS mosaic for more precision, and then display the HiRISE stereo layer. You get all areas where MarsSI proposes to compute a HiRISE DEM, appearing in light blue. The footprints are regularly updated to take into account new data. You can use for example the select button to choose the footprint you desire. {{attachment:view_hirise_stereo_layer.png||width="800"}} To add your desired footprints to your cart click on “Add” in the “Cart” window: you can notice in the “Cart” window that three data were added, the two overlapping EDR images that will be used, and the EDTM file that will be computed. Then go to the “Workspace” tab. {{{#!wiki warning The EDTM footprints have been created automatically based on the percentage of intersection and the difference in emission angle between the two EDR images. Please be advised that EDTM footprints mean only possible DTMs: a viewing validation of the EDR images should be performed from the PDS’s link available in the footprint attribute. Atmospheric clouds for example can prevent the DTM calculation. }}} Your images and DTM appear in the window “Data to process”. If not, you may already have processed it yourself, or someone else may have processed it, then it may already be in the “Data processed” window. If the images have not been processed, you will have to go through several steps: 1. Download the HiRISE EDR image (raw data) to the MarsSI server and create a calibrated RDR image as described previously. 2. Create the DTM by processing the proposed EDTM data in the “Data to process” window which may take few hours, depending on the length of the overlapping images. 3. Process the proposed ALEDTM data in the “Data to process” window to align the DEM to the MOLA data. This last step should only take few minutes. When these different steps are done, the ALEDTM is waiting for you in the “Data processed” window and you can copy it to your personal data directory. Additional information about AMES Stereo Pipeline products can be found in: http://byss.ndc.nasa.gov/stereopipeline/binaries/asp_book-2.5.0.pdf ==== HiRISE team DEM ==== This dataset was created using the commercial stereogrammetric software SOCET SET and tuned by hand by the HiRISE team. The DTMs have a 1-meter spatial resolution and 25 cm vertical precision. For more details about the process used to create HiRISE DTMs, see [[http://onlinelibrary.wiley.com/wol1/doi/10.1029/2007JE003000/full|Kirk, R.L. et al. (2008)]]. {{attachment:view_hirise_team_stereo_layer.png||width="800"}} |
.. |
| Line 77: | Line 112: |
| * HiRISE instrument and data website: http://hirise.lpl.arizona.edu * HiRISE DTM creation explanation: http://www.uahirise.org/dtm/about.php * HiRISE instrument description paper: McEwen, A. et al. (2007). J. Geophys. Res., 112, E05S02, doi:10.1029/2005JE002605. * HiRISE DTM description paper: Kirk, R.L. et al. (2008). J. Geophys. Res., 113, E00A24, doi:10.1029/2007JE003000.Additional information about AMES Stereo Pipeline products can be found in: http://byss.ndc.nasa.gov/stereopipeline/binaries/asp_book-2.5.0.pdf ==== HiRISE team DEM ==== This dataset was created using the commercial stereogrammetric software SOCET SET and tuned by hand by the HiRISE team. The DTMs have a 1-meter spatial resolution and 25 cm vertical precision. For more details about the process used to create HiRISE DTMs, see [[http://onlinelibrary.wiley.com/wol1/doi/10.1029/2007JE003000/full|Kirk, R.L. et al. (2008)]]. {{attachment:view_hirise_team_stereo_layer.png||width="800"}} == References == * HiRISE instrument and data website: http://hirise.lpl.arizona.edu * HiRISE DTM creation explanation: http://www.uahirise.org/dtm/about.php * HiRISE instrument description paper: McEwen, A. et al. (2007). J. Geophys. Res., 112, E05S02, doi:10.1029/2005JE002605. * HiRISE DTM description paper: Kirk, R.L. et al. (2008). J. Geophys. Res., 113, E00A24, doi:10.1029/2007JE003000. |
* HiRISE instrument and data website: [[http://hirise.lpl.arizona.edu]] * HiRISE DTM creation explanation: [[http://www.uahirise.org/dtm/about.php]] * HiRISE instrument description paper: [[McEwen]], A. et al. (2007). J. Geophys. Res., 112, [[E05S02]], doi:10.1029/2005JE002605. * HiRISE DTM description paper: Kirk, R.L. et al. (2008). J. Geophys. Res., 113, [[E00A24]], doi:10.1029/2007JE003000. * USGS ISIS software: [[https://isis.astrogeology.usgs.gov/]] * Ames Stereo Pipeline: [[https://ti.arc.nasa.gov/tech/asr/groups/intelligent-robotics/ngt/stereo/]] * MarsSI DEM workflow article: [[https://doi.org/10.1016/j.pss.2022.105552]] |
The High Resolution Imaging Science Experiment (HiRISE) is a telescope working in orbit in the visible wavelengths and producing high resolution images resolving surface details down to 1-meter size (0.25 to 1.3 m/px). The images enable to study for instance the martian geomorphology but also seasonal surface changes.
Instrument description
The HiRISE camera has 3 different color filtered CCDs: red (“RED”) from 570-830 nm, blue-green (“BG”) less than 580 nm and near-infrared (“IR”) greater than 790 nm. The high-resolution color images enable to distinguish the composition and albedo heterogeneities directly correlated to the geomorphology, complementary to the mineralogic results from the CRISM, HRSC, OMEGA and THEMIS instruments. The RED detectors provide a wide image used for geomorphologic analysis and for stereoanalysis, while the additional detectors are used to create false-color imaging of the central of the swath only (20% of the RED swath width).
Downloading and processing HIRISE data
Imagery
Tutorial
From the “Maps” tab, zoom-in on your region of interest. You can swith to the THEMIS or CTX mosaic for more precision, and then display the HiRISE layer. You can see the HiRISE products footprints that appear in pink. Use the “Select” button to choose the products you desire over an area. Use the right-click context menu to add your selection to your workspace.
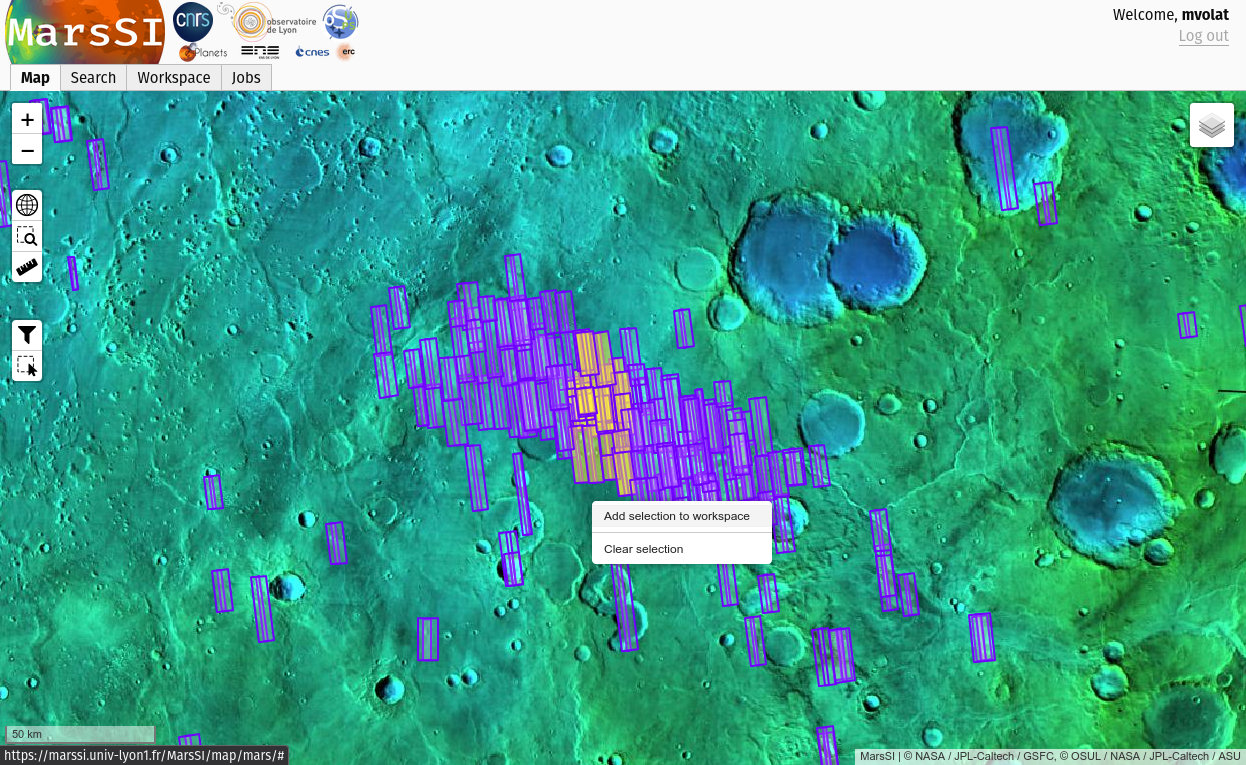
In the "Workspace" tab, you will see your product selection. You will notice that there is two type of subproducts: the RED channel with a higher coverage products and the COLOR products (see "Instrument description for more information about coverage and color information). HiRISE color images are downloaded calibrated and with georeferencement, there is no more processing on this data type. HiRISE RED images can be processed in different steps: first a raw product (EDR) is downloaded. It can be processed into a calibrated RDR product. The last step reproject and georeference the RDR product into a MRDR image.
Check the product status: if some data is not already done yet, select the rows you would like to request by ticking the input on the left column (you can use the "Select all" button to select all visible products) and click on the "Process" action on the top of the workspace table. You can check more information about the processing in the job tab if needed.
Once all the data you would like is done, select entries by ticking the input on the left column (you can use the "Select all" button to select all visible products) and click on the "Copy" action to request a copy of the data in your personal directory. You can then proceed to download products as described in the SFTP section.
Pipeline information
The pipeline for the topographic mapping derived from HiRISE images uses both the USGS ISIS system (the ISIS 3 system).
MarsSI Digital Elevation Models
Tutorial
From the “Maps” tab, zoom-in on your region of interest. You can swith to the THEMIS or CTX mosaic for more precision, and then display the HiRISE-stereo layer. You can see the HiRISE-DEM products footprints that appear in blue. Use the “Select” button to choose the products you desire over an area. Use the right-click context menu to add your selection to your workspace.
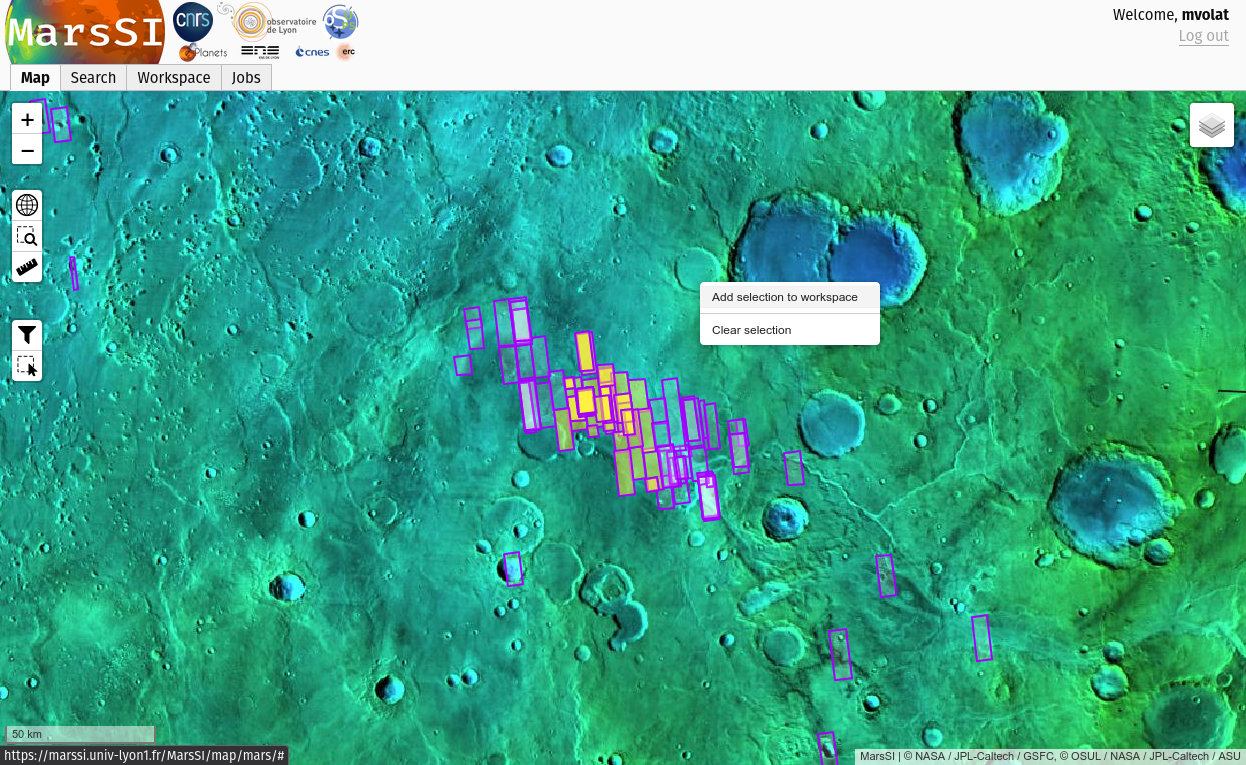
In the "Workspace" tab, you will see your product selection.
Check the product status: if some data is not already done yet, select the rows you would like to request by ticking the input on the left column (you can use the "Select all" button to select all visible products) and click on the "Process" action on the top of the workspace table. You can check more information about the processing in the job tab if needed.
Once all the data you would like is done, select entries by ticking the input on the left column (you can use the "Select all" button to select all visible products) and click on the "Copy" action to request a copy of the data in your personal directory. You can then proceed to download products as described in the SFTP section.
Pipeline information
The DEM footprints have been created automatically based on the percentage of intersection and the difference in emission angle between the two input images. Please be advised that DEM creation process can fail due to other parameters. See DemErrors for more information.
The HiRISE DEM images created by MarsSI are generated using the NASA AMES Stereo Pipeline (http://ti.arc.nasa.gov/tech/asr/intelligent-robotics/ngt/stereo/).
HiRISE Team Digital Elevation Models
Tutorial
From the “Maps” tab, zoom-in on your region of interest. You can swith to the THEMIS or CTX mosaic for more precision, and then display the HiRISE-team-DTM layer. You can see the HiRISE-DEM products footprints that appear in light blue. Use the “Select” button to choose the products you desire over an area. Use the right-click context menu to add your selection to your workspace.
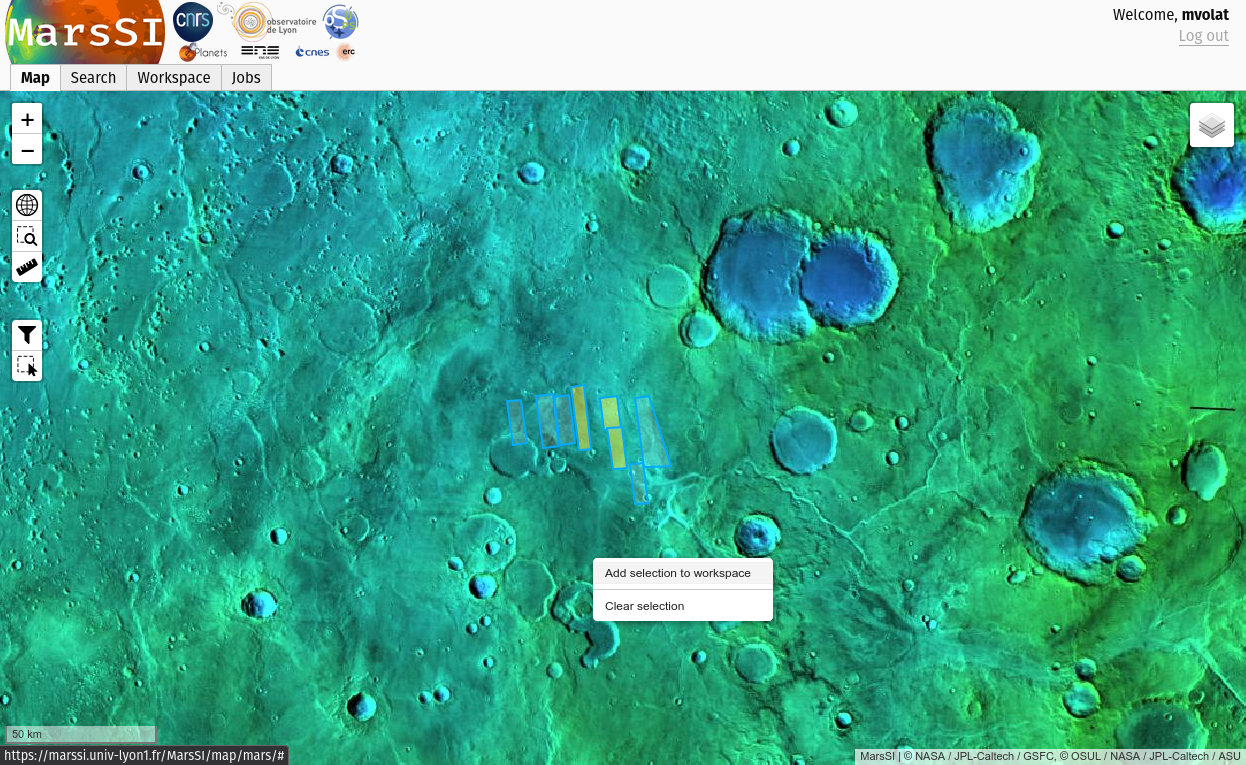
In the "Workspace" tab, you will see your product selection.
Check the product status: if some data is not already done yet (for HiRISE team DEMs, this only means downloading it), select the rows you would like to request by ticking the input on the left column (you can use the "Select all" button to select all visible products) and click on the "Process" action on the top of the workspace table. You can check more information about the processing in the job tab if needed.
Once all the data you would like is done, select entries by ticking the input on the left column (you can use the "Select all" button to select all visible products) and click on the "Copy" action to request a copy of the data in your personal directory. You can then proceed to download products as described in the SFTP section.
Pipeline information
This dataset was created using the commercial stereogrammetric software SOCET SET and tuned by hand by the HiRISE team. The DTMs have a 1-meter spatial resolution and 25 cm vertical precision. For more details about the process used to create HiRISE DTMs, see Kirk, R.L. et al. (2008).
Data description
Images
Directory content
The content of an HiRISE product directory in MarsSI should look like:
- ESP_011261_1960_RED*_*.IMG
- raw red data (EDR), multiple files
- ESP_011261_1960_RED_RDR.cub
- reflectance (irradiance/solar flux or I/F) called Radiometric Data Record, stitched in a single image
- ESP_011261_1960_RED_MRDR.tif
- projected and georeferenced image from the RDR
- ESP_011261_1960_COLOR.tif
- projected and georeferenced color image (RDRV11)
Georeferencing
Due to the ISIS format, probably only some GIS software will be able to display RDR products, but only the MRDR products have georeferencing and can be displayed in a true geographic view.
MarsSI Digital Elevation Models
Directory content
The content of an CTX-DEM product directory in MarsSI should look like:
- HI_022288_2035_022354_2035-ALIGN-DEM.tif
- DEM product, aligned to MOLA
- HI_022288_2035_022354_2035-ALIGN-DRG.tif
- left image aligned and orthorectified along the DEM at its resolution
Older directory could include non-aligned DEM/imagery.
HiRISE Team Digital Elevation Models
Directory content
.
References
- HiRISE instrument and data website: http://hirise.lpl.arizona.edu
- HiRISE DTM creation explanation: http://www.uahirise.org/dtm/about.php
- HiRISE instrument description paper: McEwen, A. et al. (2007). J. Geophys. Res., 112, E05S02, doi:10.1029/2005JE002605.
- HiRISE DTM description paper: Kirk, R.L. et al. (2008). J. Geophys. Res., 113, E00A24, doi:10.1029/2007JE003000.
- USGS ISIS software: https://isis.astrogeology.usgs.gov/
- Ames Stereo Pipeline: https://ti.arc.nasa.gov/tech/asr/groups/intelligent-robotics/ngt/stereo/
- MarsSI DEM workflow article: https://doi.org/10.1016/j.pss.2022.105552